Social media metrics that matter, and where to find them
Every network reports dozens of numbers, and most of them answer questions nobody asked. A handful tell you whether your posts reach people, whether those people care, and whether any of it moves your business. This is which ones to watch, how to read them without fooling yourself, and where to find them for every account in one place.

Rodolfo MotaFounder of SPREVA
The short version
Watch reach, engagement rate and clicks for every post; follower growth for every account; and watch time for video. Compare each with your own previous period, not with someone else's account. Read them per network and per campaign, and change one thing at a time based on what they say.
The ones that matter
Each answers a different question:
| Metric | What it tells you | Watch it when |
|---|---|---|
| Reach | How many different people saw the post | You want to grow your audience |
| Views | How many times it was seen, repeats included | You post video or Stories |
| Engagement rate | How many of the people who saw it reacted | You compare posts, formats or times |
| Clicks | How many went to your link | Posts are meant to bring traffic or sales |
| Followers | Whether people stay for more | You compare month with month |
| Watch time | How much of the video people actually watched | You make Reels, Shorts or TikToks |
Engagement rate, explained
Engagement rate is the reactions divided by the people who saw the post. In SPREVA it is likes, comments, shares and saves divided by reach; where a network does not report reach, impressions, and then views. Each rate says what it was divided by, as in "of reach", so you never compare two rates built on different bases without knowing.
The rate is what lets you compare a post seen by 300 people with one seen by 30,000. Raw likes favour whatever happened to reach more people; the rate tells you which one people actually cared about.
The numbers that mislead
Some numbers feel good and say little:
- Likes on their own. They grow with reach; without the rate, a bigger audience looks like a better post.
- Followers on their own. A follower who never sees your posts is worth less than a reader who saves every one.
- Views of video that plays by itself. A view can be a second of scrolling past; watch time says whether anyone stayed.
- One good day. A single post can travel by luck. Look at four weeks before you change what you do.
Where to find them in SPREVA
Analytics brings every connected account into one view, with five tabs:
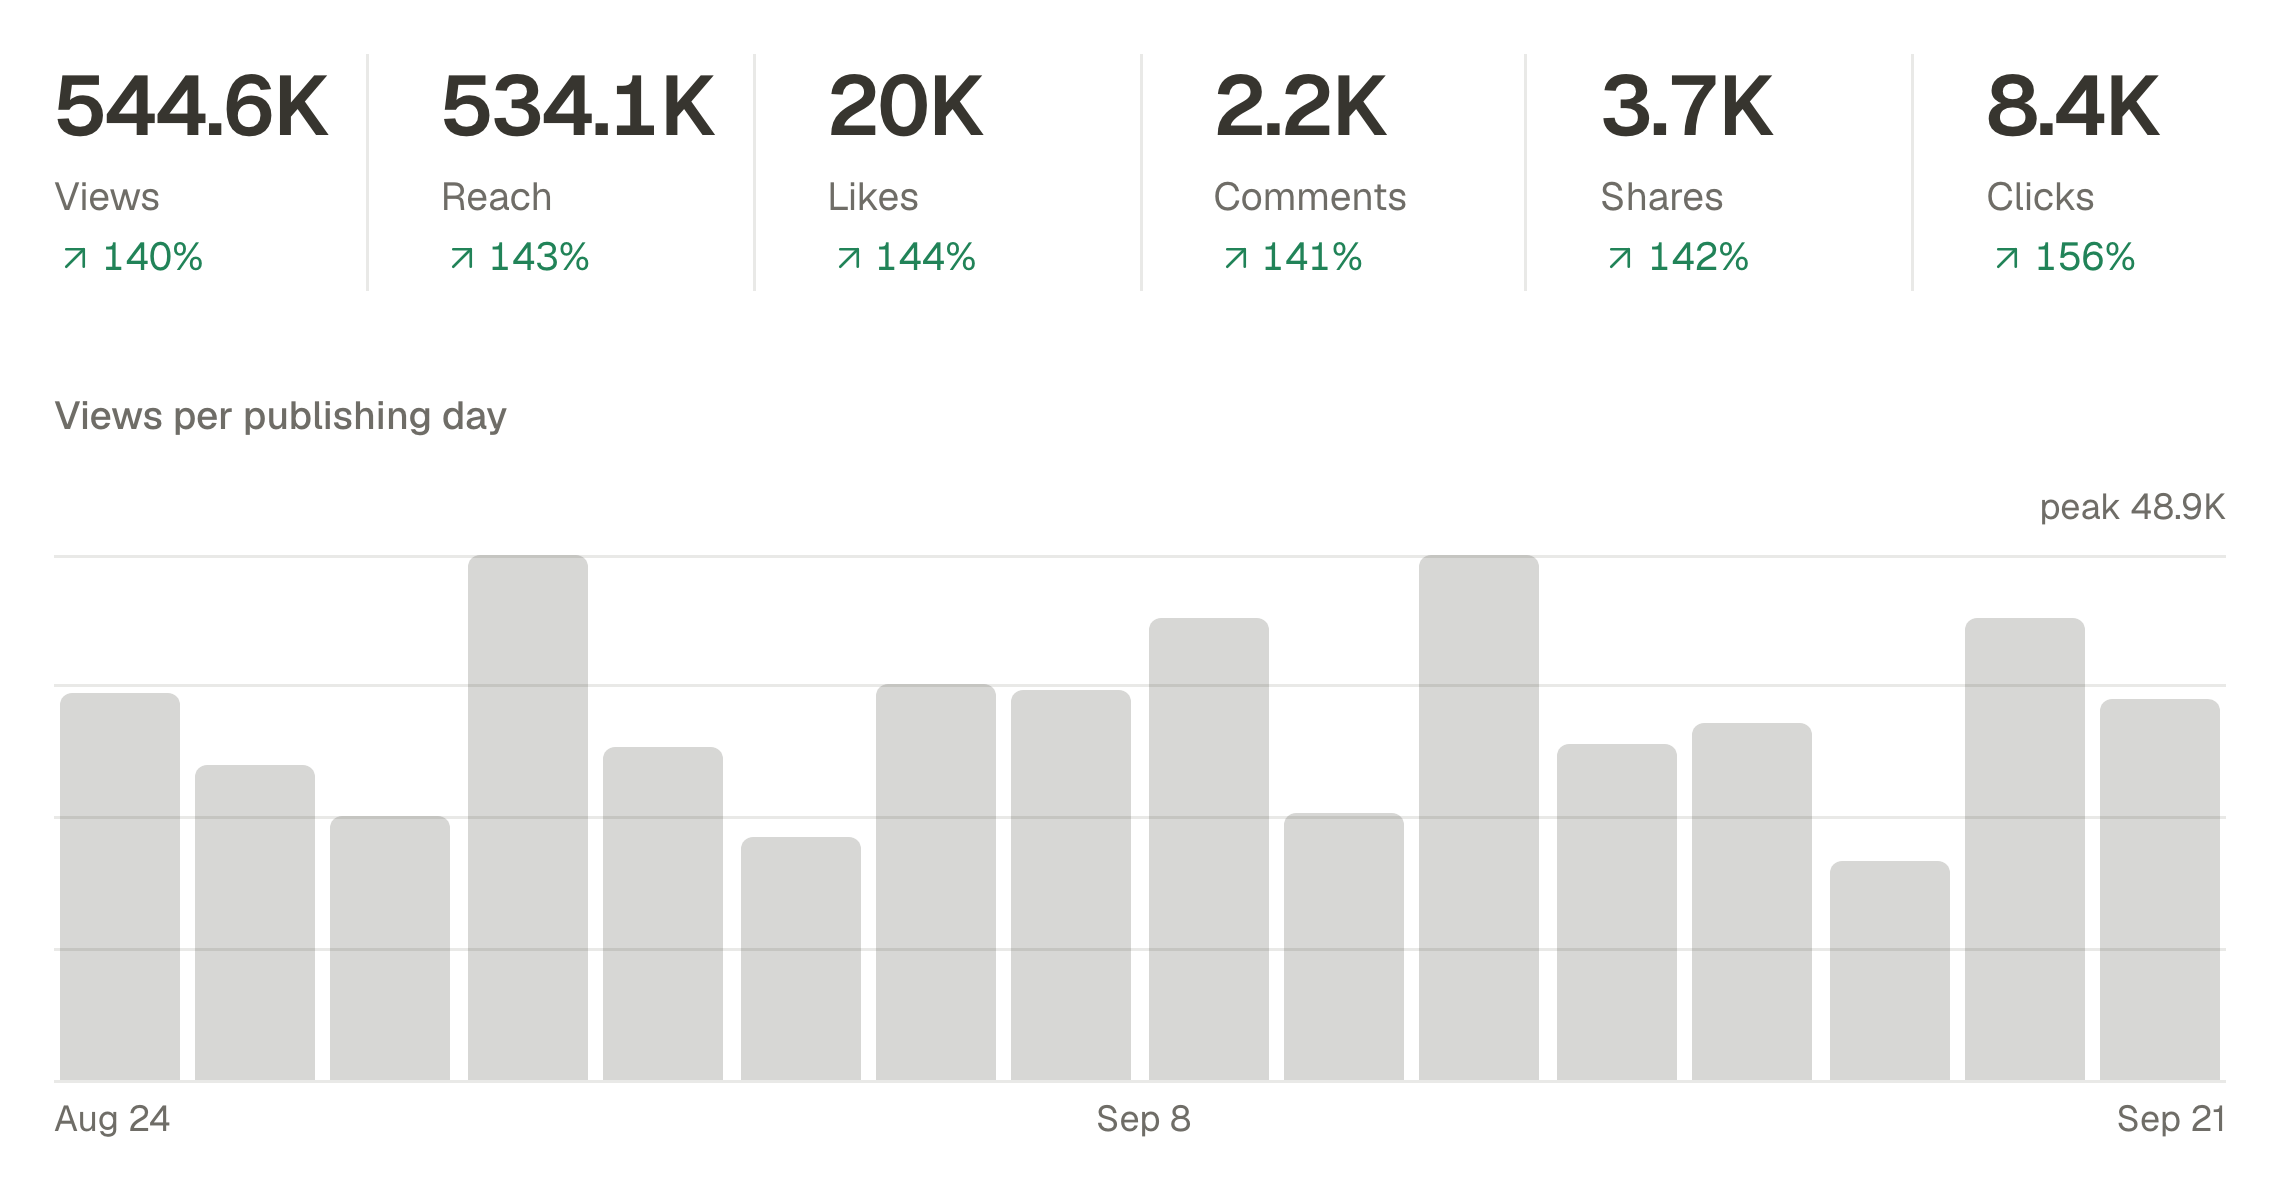
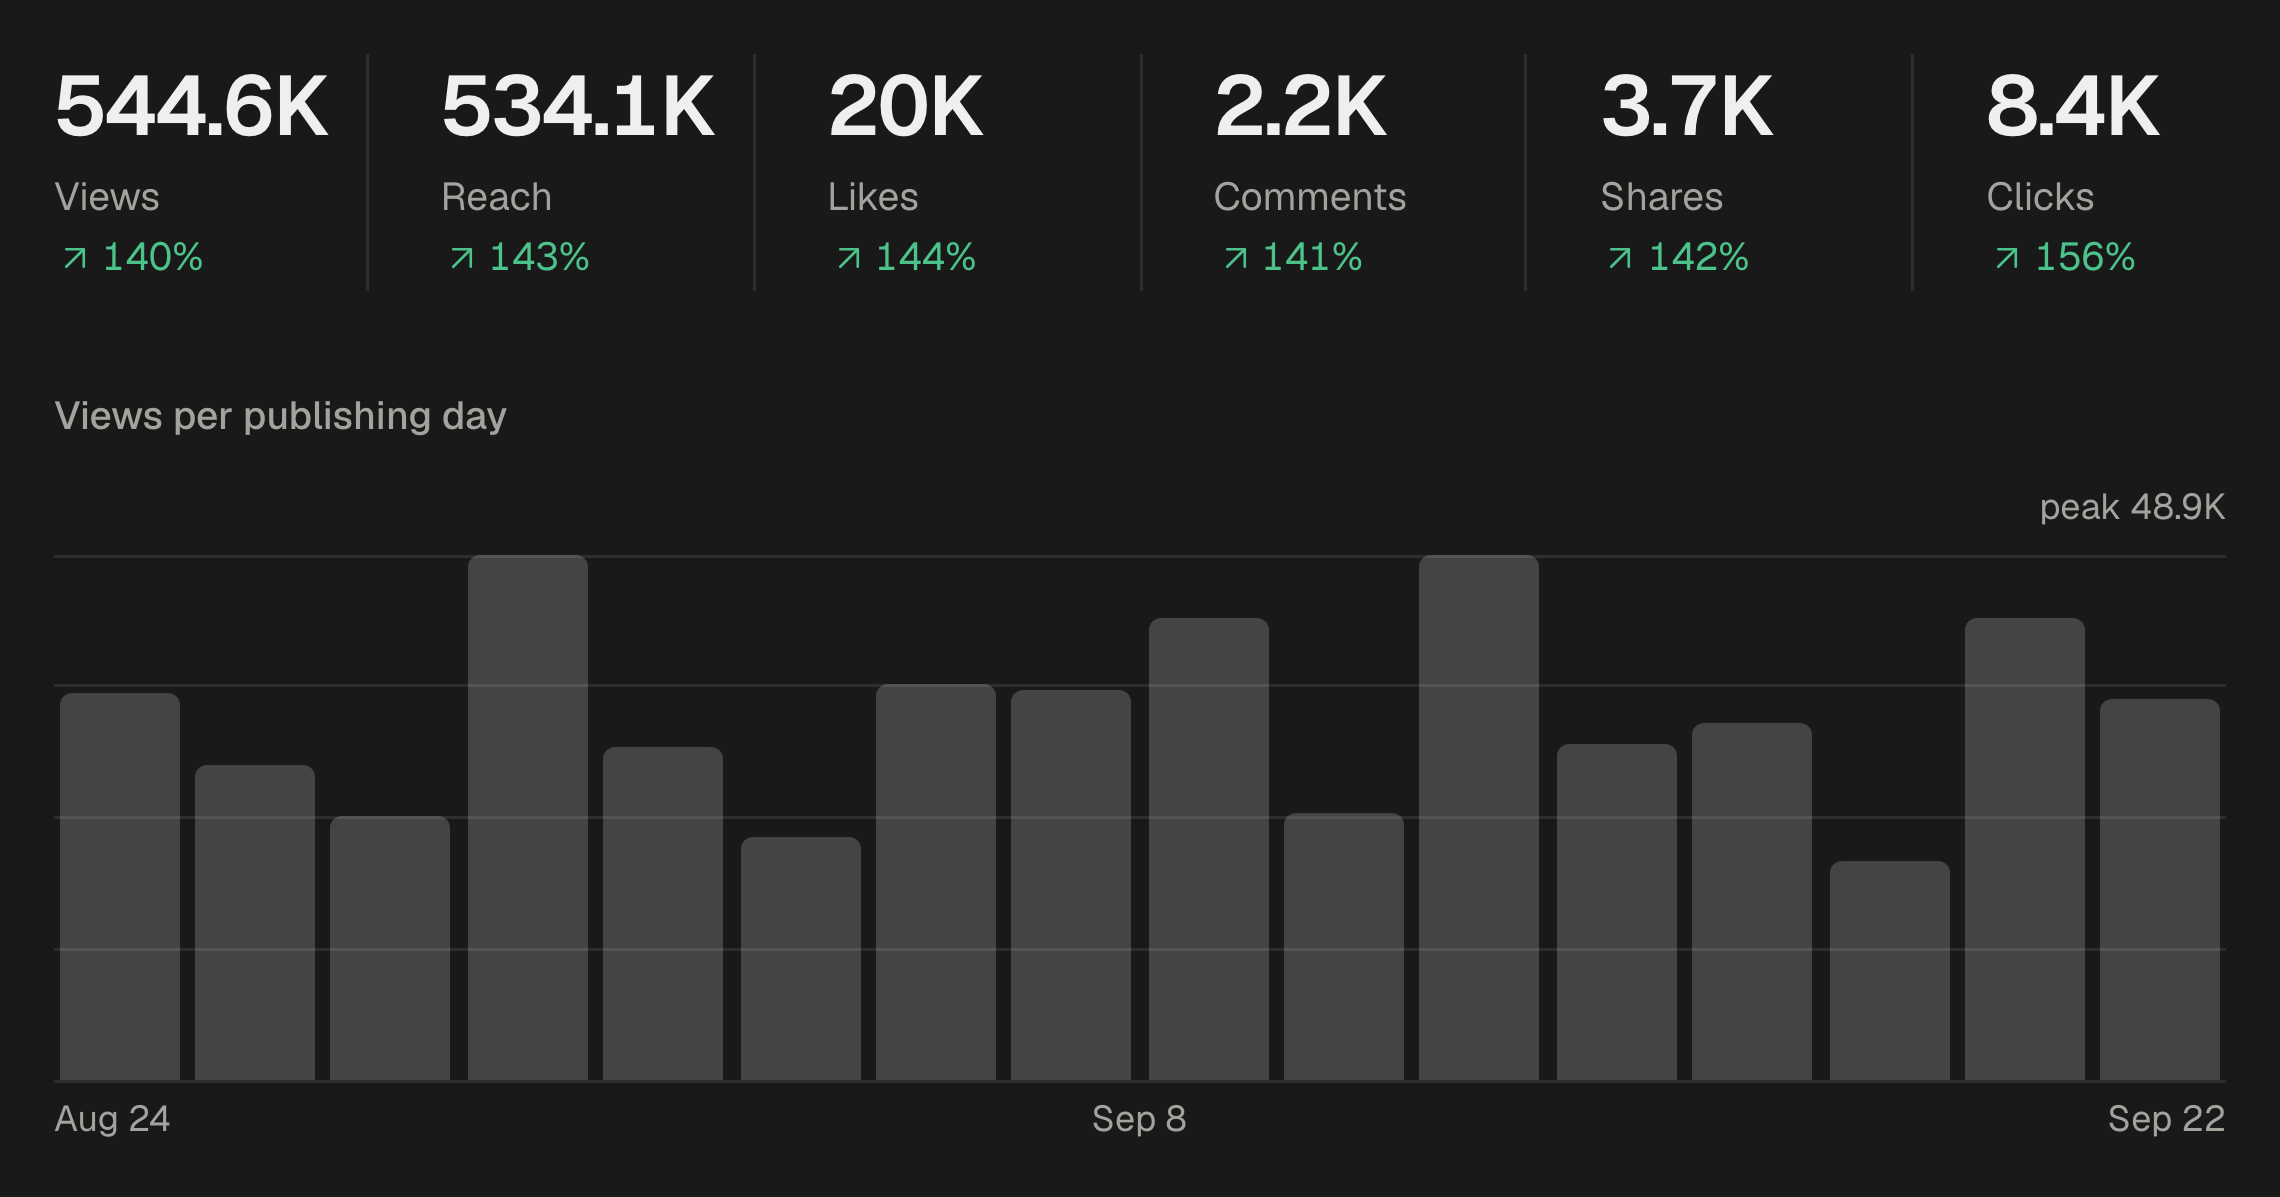
- Overview: views, reach, likes, comments, shares and clicks, each against the previous period, with views per publishing day, the platforms, the accounts and your Best content.
- Posts: every post with its numbers, to sort and compare.
- Growth: followers across the accounts you select, and each account's start, end and change.
- Engagement: the engagement rate, with saves and the rest of the reactions.
- Video: watch time and the average watched per view.
Compare like with like
Choose the last 7, 30 or 90 days or your own dates, and compare with the previous period or the previous month. Narrow the view by account, by platform or by campaign, so a launch is judged against launches and Instagram against Instagram. A dash means the network does not report that number; a zero means it reported zero.
When the numbers arrive
SPREVA reads each post's numbers an hour after it goes out, then after 6 hours, a day, 3 days, a week and a month, so you see both the first day and the long tail. Follower counts are read every day. When you need a post's numbers now, open it and press Refresh metrics.
Networks that report less
Not every network shares numbers with apps. Discord, Telegram, Slack, Twitch, Kick, Medium, WordPress and Google Business Profile report none, so for them SPREVA shows whether each post went out. Reddit and a few others report each post's numbers but not your followers.
From numbers to decisions
Numbers are only worth reading if they change what you do next:
- Make more of what wins. Look at Best content each month: the format, the subject and the network that keep coming back.
- Test one thing at a time, such as your posting time, with two campaigns side by side. The best time to post is yours: how to find it with your own numbers.
- Report the month to your team or a client, with the CSV export of the same view. How to send a client a monthly social media report.
Or ask an AI agent connected to SPREVA to read them for you:
How did last month go compared with the month before? Show reach, engagement rate and clicks per network, and tell me what the three best posts have in common.
Read your last month
Connect your accounts, open Analytics, compare the last 30 days with the 30 before, and write down one thing to change. Every plan starts with a 7-day trial.
Questions
What is a good engagement rate?
The one that is higher than your own last month. Rates vary so much by network, format and audience size that your own history is the only fair comparison.
What is the difference between reach and impressions?
Reach counts different people; impressions count every time the post was shown, so one person who saw it three times is one in reach and three in impressions.
Why do some numbers show a dash?
A dash means that network does not report that number. A zero means it reported zero.
Can I export the numbers?
Yes. The CSV button exports the view you are looking at: the totals, each platform, each account and each post, with views, impressions, reach, reactions, clicks, watch time and engagement rate.
Does SPREVA track follower growth?
Yes, for the networks that report followers: the Growth tab shows them across your accounts and the change for each over the period.
Written by
Rodolfo Mota
Founder of SPREVA
Makes SPREVA in Portugal: the Studio, the tools an agent works with, and the publishing behind them.
Keep reading
- How to send a client a monthly social media reportWhat a monthly social media report should say, and how to pull it from SPREVA: the numbers against last month, the posts that worked, and what comes next.
- The best time to post is yours: how to find it with your own numbersNo universal best time to post fits your audience. How to test two posting times for four weeks with queues and campaigns, and read the answer in your numbers.
- How to plan a month of social media in a content calendarHow to plan a month of social media posts in one sitting: a rhythm, campaigns for the fixed dates, themes, and a calendar to see and move it all.